From 0 to over 4,000 clicks a month from Google
I own and build a Danish calculator site. It is my own, so the numbers here are mine to show. Since September the site has had over 4,000 clicks a month from Google's search results. Before February 2026, Google Search Console showed no measurable data for it.
Search Console sums it up like this: 16.2K clicks, 3.06 million impressions, a CTR of 0.5% and an average position of 8.4.
- clicks from Google in Sep 2026, the highest month
- 4,342
- impressions in Oct 2026, the highest month
- 869,203
- average position, from February to November
- 44.3 → 7.6
- pages with impressions, from February to November
- 7 → 242
Where it started
The site is a collection of tools: a date calculator, a percentage calculator, a time calculator, a distance calculator, countdown pages for public holidays and events, pages that answer what time it is in a given city, and finance calculators with this year's rates. The site is in Danish.
In February 2026 there were 8 clicks, 2,106 impressions and 7 pages with impressions. The average position was 44.3. In other words, there was almost nothing to start from.
What I did
1. Real tools first, text afterwards
Every page is a calculator that solves the task on the page itself. The answer comes first. Below it come an explanation and examples, and an FAQ at the bottom.
2. This year's rates, with a source
The finance calculators show the year and the current rates, with a source link and the date I last checked them. The figures in the text are computed from the same constants as the calculator, and a test fails if text and calculator drift apart. Searches like "topic calculator 2026" rank in the top 3.
3. Official data through open APIs
Housing data, electricity prices, official exchange rates, inflation and route calculation come from public Danish and open data sources instead of guesses.
4. Programmatic SEO, but only where there is a real search behind it
Countdowns and pages about what time it is in a city are template pages built from data, and each page has its own answer. The number of pages with impressions went from 7 to 242.
5. SEO quality as automated tests
Meta descriptions, titles, canonical tags and internal links are checked on every build in CI. The site is built in Next.js with static generation, so the pages are fast.
6. Technical cleanup when Search Console showed something
www variants that returned a 404 got a 301 to the main domain. The 404 page had conflicting meta tags, and I fixed that. New pages are sent to Bing with IndexNow.
7. Calm during algorithm updates
After the spam update in March I made no panic changes. The pages kept getting better, and the traffic came back.
The results
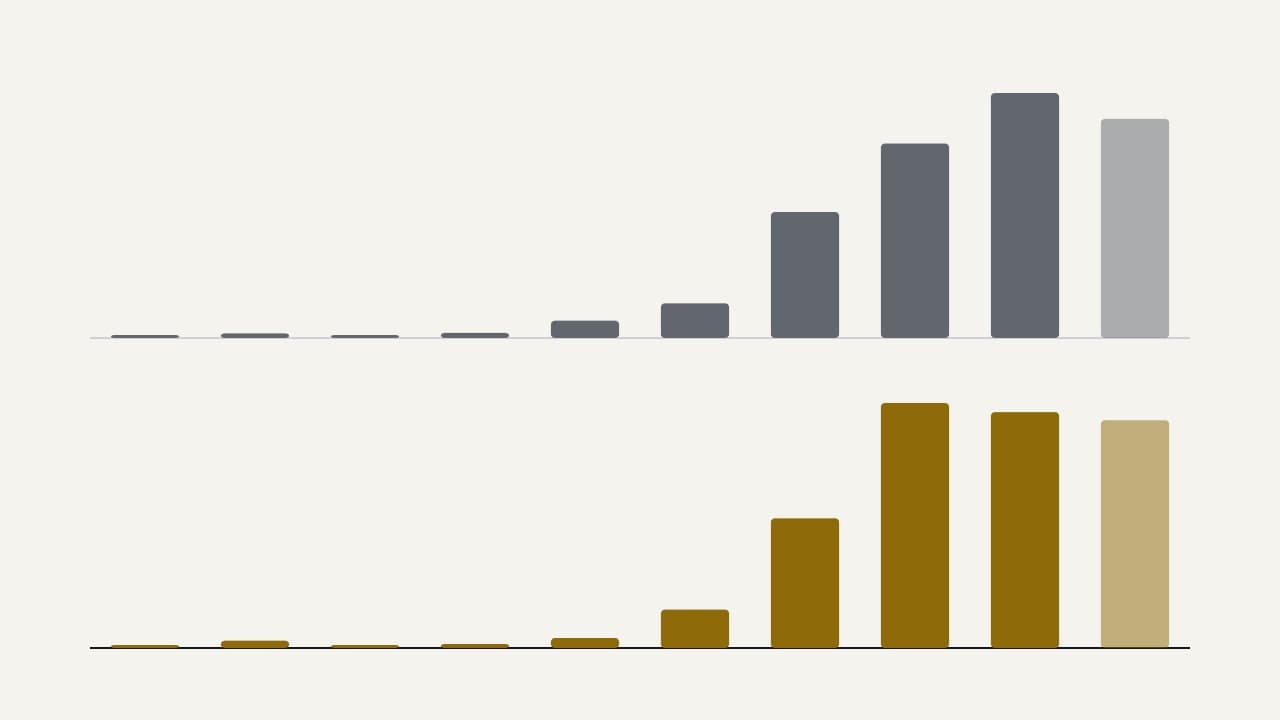
Clicks per month
Impressions per month, in thousands
* The month is not over: the figures cover 1 to 19 November. Source: Google Search Console, web search, retrieved 22 Nov 2026.
Show the figures as a table
| Month | Clicks | Impressions | Avg. position | Pages with impressions |
|---|---|---|---|---|
| Feb 2026 | 8 | 2,106 | 44.3 | 7 |
| Mar 2026 | 130 | 16,439 | 21.9 | 17 |
| Apr 2026 | 35 | 8,644 | 25.1 | 22 |
| May 2026 | 71 | 17,927 | 22.5 | 53 |
| Jun 2026 | 177 | 61,229 | 16.0 | 70 |
| Jul 2026 | 680 | 123,149 | 11.5 | 75 |
| Aug 2026 | 2,299 | 446,954 | 8.5 | 117 |
| Sep 2026 | 4,342 | 690,043 | 7.6 | 152 |
| Oct 2026 | 4,181 | 869,203 | 7.8 | 224 |
| Nov 2026* | 4,037 | 777,262 | 7.6 | 242 |
Impressions started to climb in June and picked up speed in August. Clicks followed: 680 in July, 2,299 in August and 4,342 in September. The site has stayed above 4,000 clicks a month: 4,181 in October and 4,037 in November, even though November is only counted up to the 19th.
The average position went from 44.3 in February to 7.6 in September and November. In the middle of November the site gets about 200 to 280 clicks and 40,000 to 55,000 impressions a day, and 58% of the clicks come from mobile.
The share of searches with 3 words or more rose from 50% to 81%. Of the 242 pages with impressions, 181 have had clicks.
November by page type
| Page type | Impressions | Clicks |
|---|---|---|
| The date calculator | 117,000 | 592 |
| The distance calculator | 73,000 | 486 |
| The time calculator | 67,000 | 131 |
| Countdown pages (30 pages) | 58,000 | 149 |
| The percentage calculator | 45,000 | 23 |
| What time is it in a city (21 pages) | 40,000 | 17 |
Events along the way
Google's March 2026 spam update on 24 and 25 March cost 55% of the impressions from one day to the next. The site recovered in May, and I did not remove any pages.
There were two clear jumps. On 25 May, impressions per day rose by 334% when the time calculator and the percentage calculator broke through. On 2 August they rose by 238%, when the date calculator did. Google's November 2026 core update from 10 November hit guide and list sites, but not tool sites like this one.
What did not work, and what I learned
The CTR is only 0.5%, and that is low. The reason is that Google answers many calculations itself, right in the search result, especially percentages and dates. The percentage calculator has 45,000 impressions and 23 clicks. Impressions are not traffic, and I do not count them as such.
The spam update in March was a loss, not a success: 55% of the impressions disappeared from one day to the next. I did not change anything out of panic. I kept improving the pages, and the site recovered without removing any.
The November update did not hit the site, although it hit other kinds of sites. That is an observation from one site and not a rule.
What it means for you
I can do the same for your site, but I do not promise numbers. A calculator site is not your business, and your searches and your competition are different, and so is your starting point. What I can promise is the method: real content with sources you can follow, and tests that keep the quality up. That keeps things calm when Google changes.
If you want to know where your site stands today, you can start with a free check or book 15 minutes. You can also read about how I work with SEO or as a technical partner.